
Elections · August 25, 2026
The Election-Year Install Tax
A game studio’s user-acquisition budget and a Senate campaign’s media buy are competing for the same inventory. One of them is not price-sensitive.
The claim
If you buy mobile installs in the United States, the fourth quarter of an election year costs more than the fourth quarter of any other year — not because players changed, and not because your creative got worse, but because a few billion dollars of political money entered the auction you were already bidding in.
This is unremarkable as a mechanism and surprisingly awkward as a forecasting problem, and the awkwardness is the interesting part. It is one of the very few sources of seasonality in a game’s cost base whose timing is known years in advance and whose magnitude is nearly impossible to estimate.
There is a midterm this November, which is a reasonable moment to write it down.
The public picture
Political advertising in the US is now large enough, and digital enough, to move prices for everyone else in the room.
Total US political ad spending reached $12.32 billion in the 2024 cycle, up roughly 29% on 2020. The digital share is what changed: digital political spending rose 156% over 2020 to $3.46 billion, taking digital from 14.1% of political spend to 28.1%.
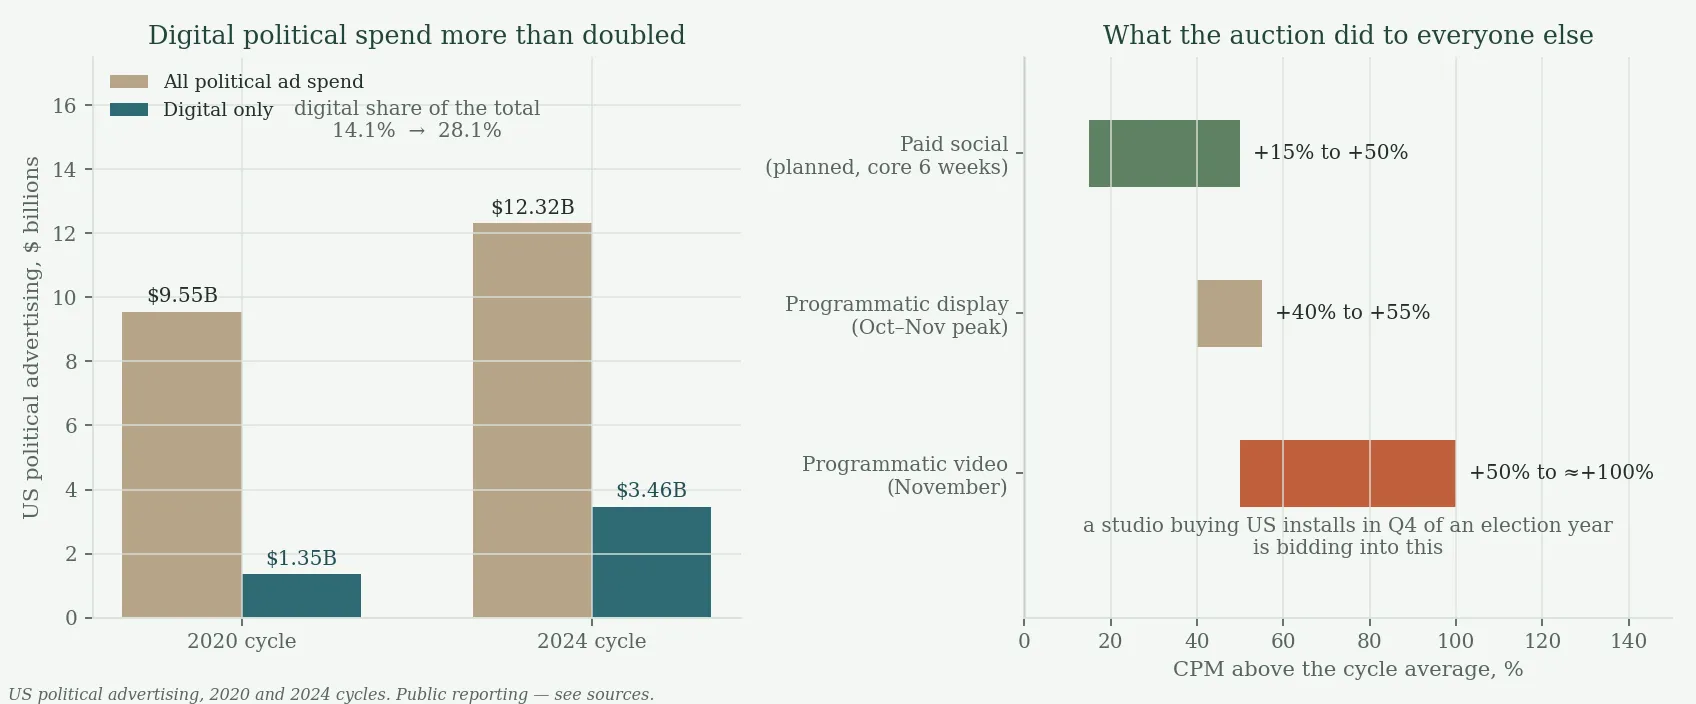
And the price effect is documented rather than inferred. Programmatic CPMs for political campaigns climbed steadily from July and peaked 40% or more above the cycle average in October and November; programmatic video in November ran at roughly double the cycle average, having already been 50%+ above it in October. Marketers planned for 15–50% higher CPMs on connected TV and higher CPMs and CPCs on paid social through the core six weeks.
The mechanism is a first-price-ish auction with one participant who is not optimising for return. A campaign has a fixed, non-renewable deadline and a war chest that has no value on 6 November. It will pay whatever clears. A studio buying installs is bidding against an opponent with no payback constraint, in the specific weeks when that opponent’s willingness to pay peaks.
What it looks like in a game’s own numbers
Public CPM benchmarks are the wrong altitude for a UA plan. The question is what happens to your blended CPI, and that depends entirely on how much of your spend is American.
Working through one account’s monthly CPI history, three things held:
The Q4 uplift is real and it is specifically American. Detrended, the core US market’s fourth quarter in an election year sits materially above its own off-year fourth quarter — while the other country tiers barely move. Their Q4 bumps are the ordinary retail-season kind and look the same in every year. This is not a global seasonal effect with a US flavour. It is a US effect that shows up in the blend in proportion to your US spend share.
Midterms and presidential years are different animals. The midterm uplift came in at roughly a quarter to a half above the off-year baseline. The presidential-year peak was materially larger than that — a different order of magnitude of disruption, not a slightly bigger version of the same one.
And an aggregate CPI line cannot express any of this. “The US got expensive for eight weeks” is a statement about one cohort of the media plan. A single blended series has nowhere to put it: the blend rises, the model attributes it to time, and the following year’s forecast inherits a phantom trend. A model that prices country tiers separately and re-blends by the planned allocation absorbs it as what it is — a shift in one cohort’s price, weighted by how much of the plan sits in that cohort.
That is the same structural argument that wins the CPI bake-off for completely unrelated reasons, and it is nice when a modelling choice pays twice.
The part that does not work
The obvious move is to add an election flag: a dummy for election-year Q4, fitted on history, carried into the forecast.
It was tried, and it should not ship.
The problem is sample size in the worst possible place. A single presidential cycle in the training window is one observation of the thing you care about. Fit a flag across a history containing one presidential Q4 and several midterm or off-year ones, and the coefficient is dominated by the milder events. It learns the midterm bump, applies it to the presidential year, and under-shoots the peak badly — while carrying the false confidence of a fitted parameter with a standard error attached.
And you cannot validate it. Out-of-time testing needs the event to recur inside the evaluation window, and presidential elections recur every four years. On a three-year usable history, there is no honest backtest of a presidential-year term. There is only an in-sample fit and a hope.
So the rule I would apply: carry it as an exogenous scenario overlay on the US cohort, not as a fitted model term. Two named scenarios — midterm and presidential — applied to the American cohort of the forward plan, sized from public CPM reporting and whatever internal history exists, and labelled as an assumption on the slide. A scenario that says “we are assuming this” survives contact with a bad outcome. A fitted coefficient that was really an assumption does not.
This is a general shape worth naming. Some effects are known-calendar, low-frequency, high-magnitude — elections, a console generation transition, a platform policy deadline. They are exactly the events a time-series model is worst at, because the model’s strength is repetition and these do not repeat often enough to learn from. The right treatment is a scenario, owned by a human, sitting beside the statistical forecast rather than inside it.
What a studio actually does with this
Plan the calendar, not just the budget. The timing is known years ahead. If a US-heavy campaign can move a month either side of the peak, moving it is worth more than any bidding optimisation available inside the peak.
Price the plan at the expensive end. Installs are spend divided by CPI, and that division is convex — under-forecasting the price doubles the install estimate where over-forecasting removes only a third. In a quarter where price risk is one-sided and upward, committing to install targets at the optimistic end of the band is a way of guaranteeing a miss.
Shift the mix rather than the total. If the American cohort’s price rises and others do not, the plan’s cheapest response is reallocation. This is only available if the forecast is cohorted; a blended number cannot tell you which cohort got expensive.
Watch realised cost weekly through the window, and refit rather than wait. The monitoring rule that governs the rest of this chain applies with more force here: compare realised spend-per-install against the band, and refit after two consecutive periods outside it instead of riding out the horizon.
And do not read the recovery as a win. Prices fall again in December, and a CPI series that drops after an election looks like an efficiency improvement to anyone reading month-over-month. It is the auction emptying out.
The honest limits
One account, one cycle, is not a coefficient. The magnitudes above are what one UA operation experienced, and the presidential figure rests on a single occurrence — which is precisely the argument for treating it as a scenario rather than an estimate.
It is also a fact about your country mix, not about your game. A studio whose spend is mostly outside the United States has a much smaller version of this problem, and the right way to size it is to take the US cohort’s uplift and weight it by the US share of the forward plan. That is a two-line calculation that a blended CPI forecast cannot do at all, and it is most of the practical value here.
The rest is a reminder that the most expensive weeks in a UA calendar can be driven by something that has nothing to do with games, is entirely predictable in timing, and is entirely unpredictable in size.
Related: Forecasting CPI, where the structural model that absorbs this is built, and the Cohort LTV Forecasting series it belongs to.
Sources: 2024 political ad spending will jump nearly 30% vs 2020 — eMarketer · 2024 US elections digital advertising trends — Basis · How political advertising will impact the media landscape in 2024 — Basis · Breaking down the 2024 political ad spending trends — Strike Social · How will Election 2024 affect social media ad rates? — Gupta Media