
Game analytics · Part 02 of 8 · August 24, 2026
Weekly or Monthly? What the Grain of a Forecast Is For
Written to a disclosure policy: errors, rankings, biases and coverage are reported as measured; totals, prices and dates finer than a year are withheld, and the two titles are pseudonyms. Every figure traces to a named table, listed at the end.
The question
The cost-per-install work was built on monthly periods, because that is the grain the legacy warehouse offered and the grain UA budgets are usually written in. But I had a raw player-day feed for the same account, which meant I could rebuild the entire chain at weekly grain — roughly four times as many observations, each with a daily install denominator.
More data is not automatically better data. The question I actually wanted answered was narrower than “is weekly more accurate”: does the method survive a change of grain, is the finer grain more useful for the decision a studio makes, and can either grain tell you when it has stopped working? Those are three different questions, and it turned out they have three different answers.
Why the grain is not a free parameter
A weekly series is not a monthly series cut into four. Cohorts are a quarter of the size, so each rate is noisier. A twelve-month horizon becomes fifty-two weekly steps instead of twelve monthly ones, and any model that chains from one period to the next now compounds its error four times as often. And a weekly model has more recent observations, which means it weights whatever just happened more heavily — a virtue when the world is calm and a liability the week after a regime break.
So finer grain buys freshness and pays for it with sensitivity. Whether that trade is worth making depends on the quantity. A level or a ratio, like CPI, does not compound; a fresher reading is nearly pure gain. A cohort curve compounds by construction. My initial instinct was that weekly would win on CPI and I was less sure about anything else.
My approach
The same structural model family, re-run at weekly grain with ISO weeks, on
eighty-five rolling origins instead of seventeen
(weekly__weekly_model_selection). Before any modelling, I reconciled the two
grains against each other to make sure I was comparing the same account and not
two different aggregations of it.
Then two practical tests. First, a quarter-ahead install plan — the thing a UA lead actually commits to — forecast from each grain and scored on sixteen quarters. Second, a refit-trigger rule: flag when realised spend-per-install falls outside the forecast band two periods running. The idea is a control chart. A model that cannot tell you when it has broken is a model you have to babysit.
The assumptions doing the heavy lifting
Both grains describe the same account. Checked, not assumed. Summed to the
panel, spend reconciles exactly, paid installs differ by 0.34% and organic
installs by 0.43% (weekly__weekly_monthly_reconciliation). The residual is
weeks that straddle month boundaries.
A replicated ranking is stronger evidence than a replicated error rate. The weekly and monthly panels share an account but not their noise. If the same model family orders the same way on both, that says something about the method. If only the error rate matched, it could be coincidence.
“Broken” means realised cost leaving the band twice running. That is a choice. A different trigger would fire at a different rate, and I have not swept it.
Where reality became inconvenient
Weekly is far worse coming out of a structural break. The same property that makes the weekly model fresher makes it worse at exactly the moment a studio most needs a forecast: after something changed. It has more recent observations, so it weights the anomaly more heavily and takes longer to let go of it.
The trigger fires more often than anyone would want. Twenty-two triggers in forty-eight weekly periods through a known regime break is a “look at this” signal, not an auto-refit. The threshold would need tuning before it went into a reporting layer, and tuning it on one break on one account would be fitting the alarm to the fire.
Finer grain reverses on cohorts. I repeated the comparison on cohort curves rather than on CPI and the result inverted entirely: monthly cohorts won on every metric, by wide margins. That is not a surprise given the mechanics — quarter-size cohorts and four times as many chained steps — but it does mean there is no such thing as “the right grain” for a forecasting stack. There is a right grain per quantity.
What the estimates actually say
The method replicates. At weekly grain the structural model is on top and the trend model is last, the same ordering as monthly. The weekly champion scores a mean MAPE of 0.473 on eighty-five origins with a median of 0.351. The mean is inflated by a worst origin of 1.907; the median is the better summary of a typical week.
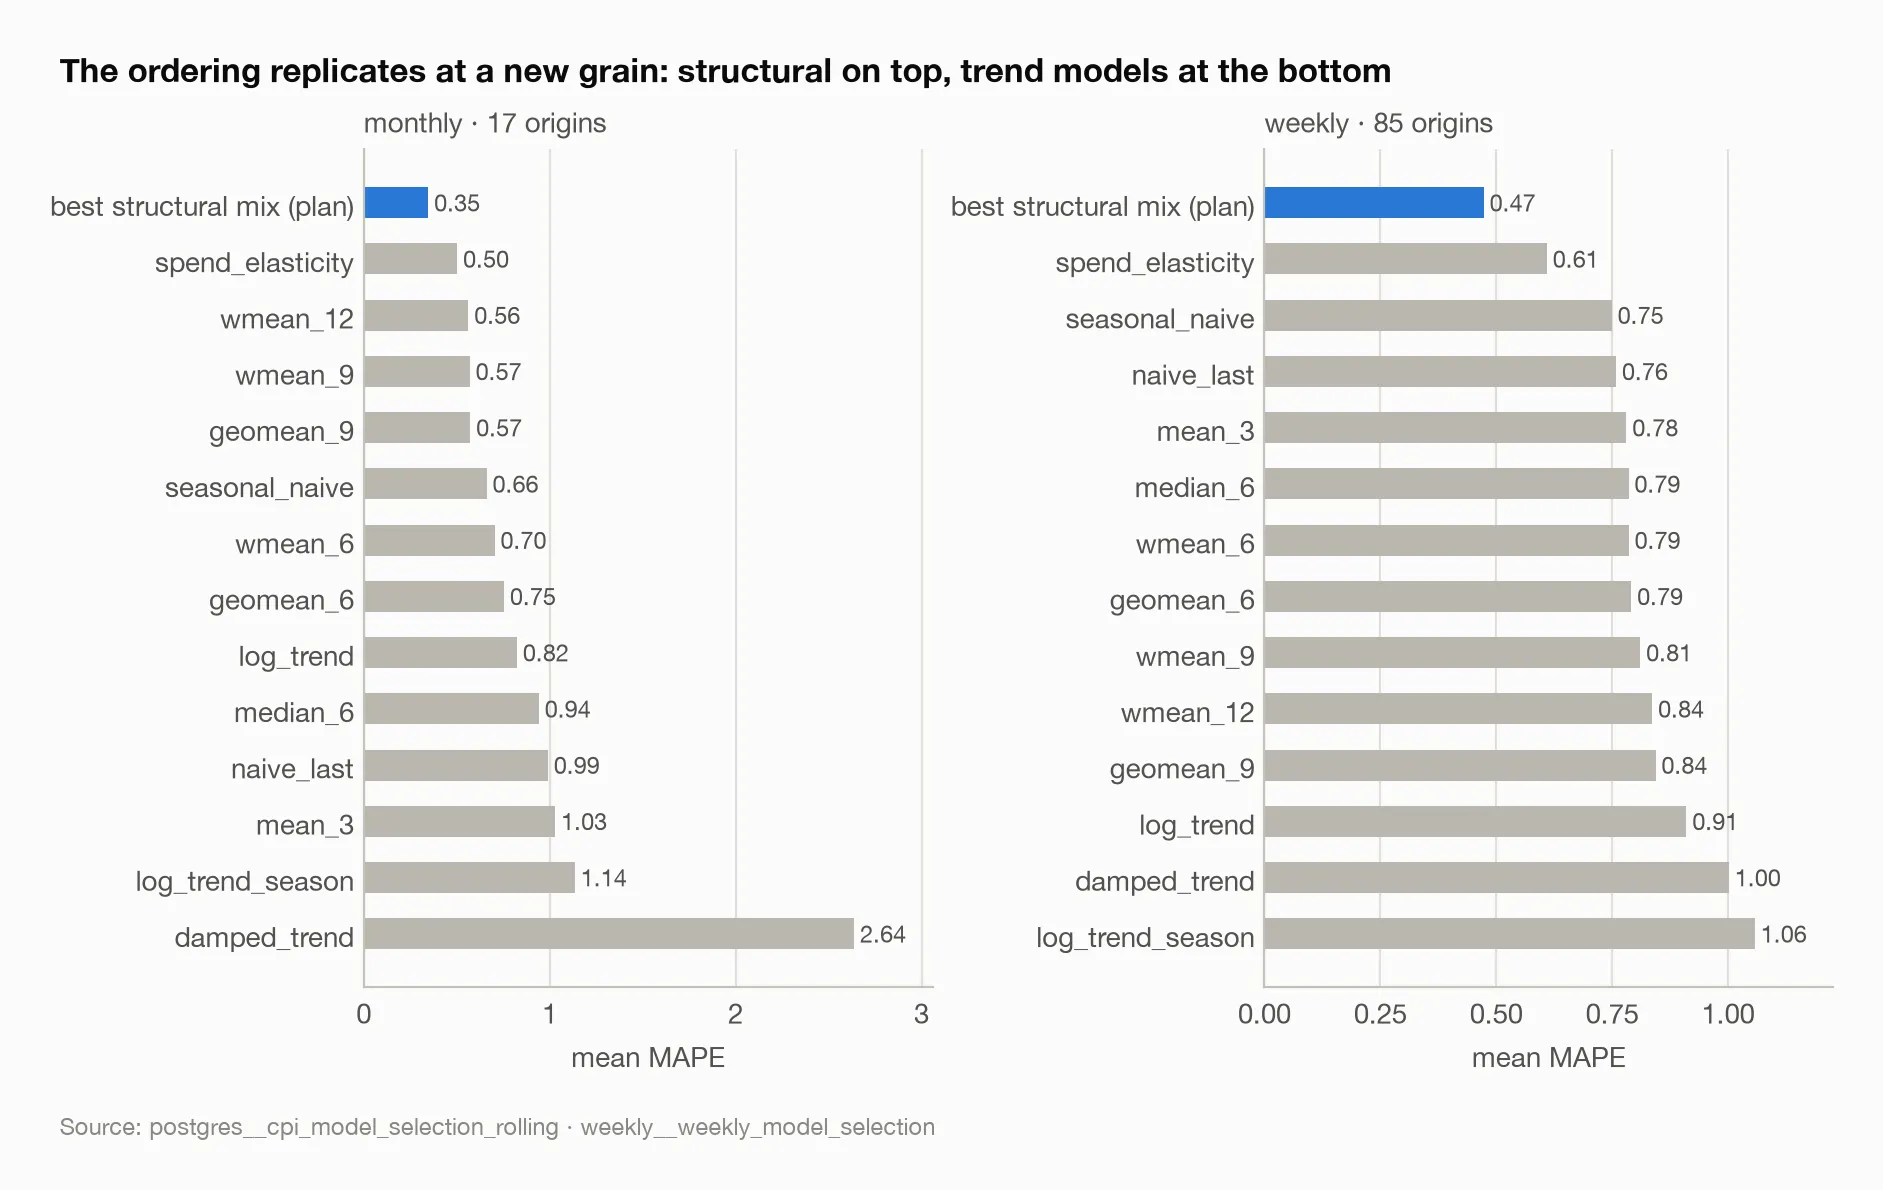
The two panels share an account but not their noise, and the structural model is on top in both while the trend models sink to the bottom of each. The absolute levels are not comparable across grains; the ordering is the evidence.
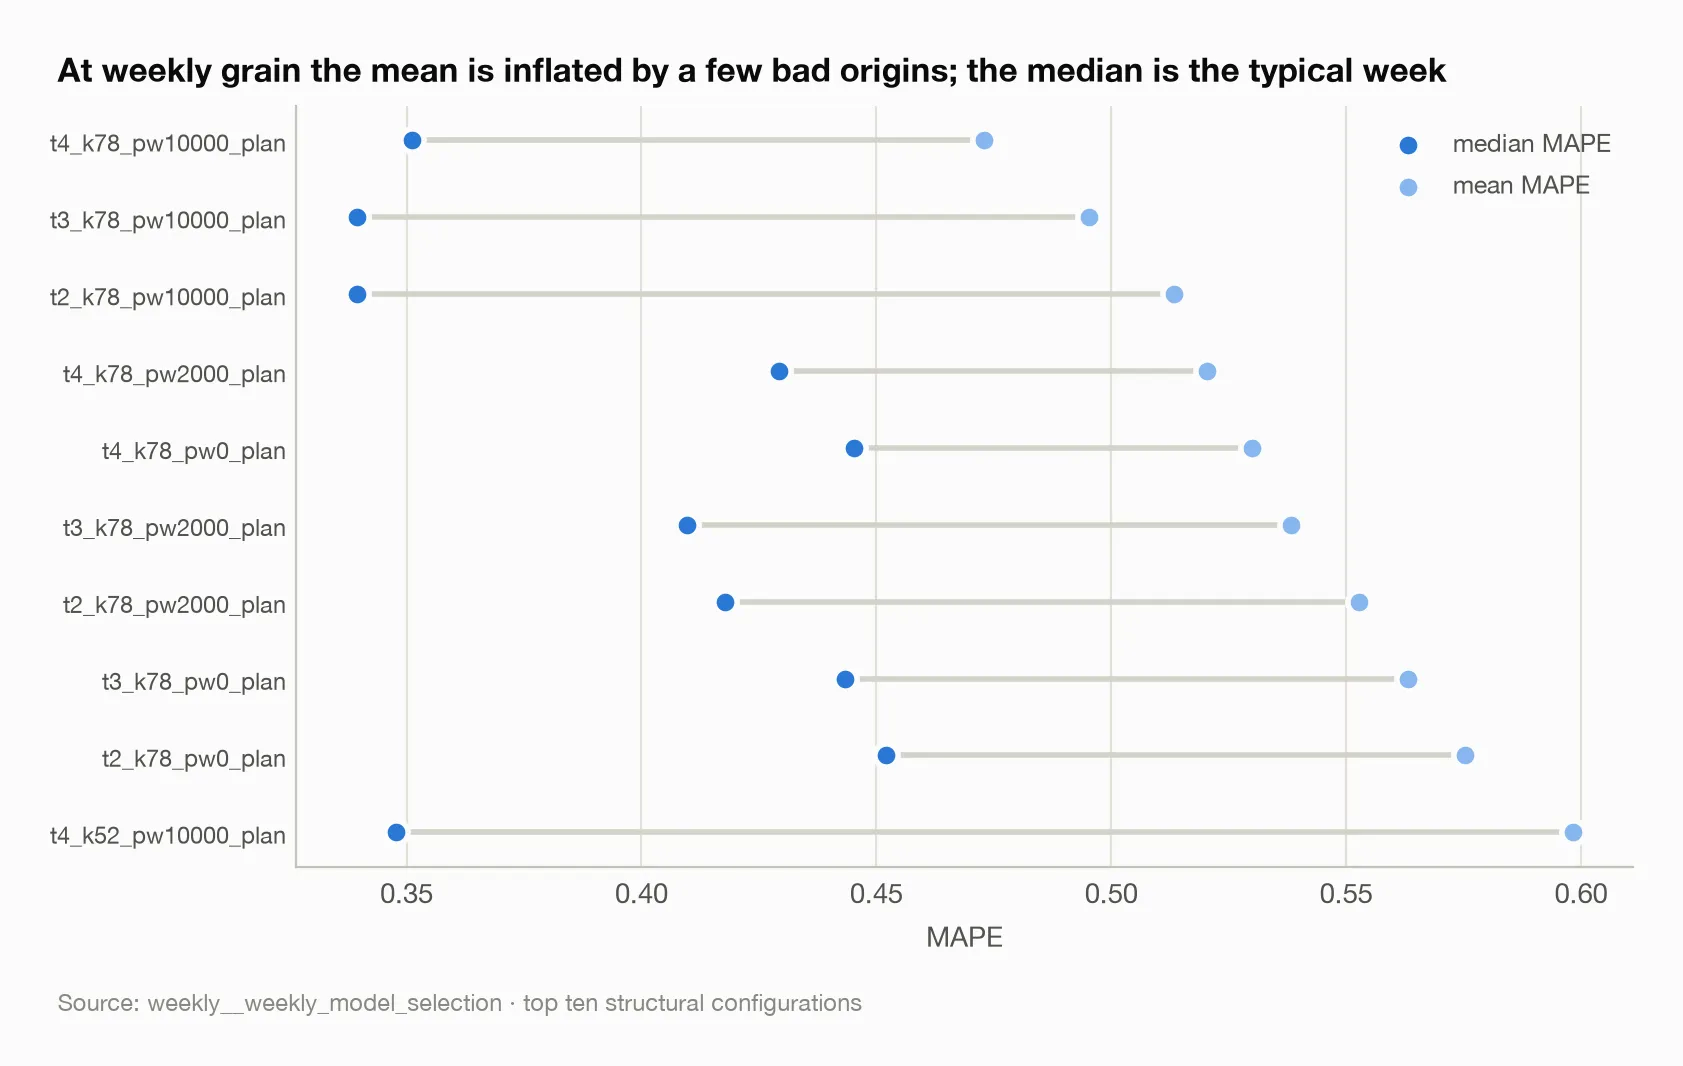
Every top configuration has a mean well to the right of its median, which is what a handful of bad weeks around a regime break does to an average over eighty-five origins. The median is what a typical week looks like; the gap is what the break cost.
For a quarter-ahead plan, weekly wins clearly. Median absolute error on a
quarter’s installs is 0.143 from the weekly model against 0.34 from the monthly,
and weekly is closer in eleven of sixteen quarters
(weekly__weekly_model_selection, planning rows). That is a large practical
difference for the decision a UA team actually makes.
Only the weekly monitor works. Through a known regime break — a roughly threefold move in cost — the weekly trigger fires twenty-two times in forty-eight periods. The monthly trigger fires zero times in eleven. A monthly band is wide enough to absorb a regime change, which makes it useless as a monitor. This is the most practically useful thing in the whole comparison: the weekly model’s one weakness is exactly the condition its own monitor detects and the monthly monitor cannot.
Put together, the recommendation writes itself and it is not “pick one”. Forecast CPI weekly. Monitor at the weekly grain. When the monitor fires, fall back to the coarser grain until the break resolves, because the coarser grain is the one that does not over-weight the anomaly. Forecast cohorts monthly, for reasons that have nothing to do with CPI.
What I would change next time
Sweep the trigger. Two periods outside the band is one rule. The trade between false alarms and detection delay is a curve, and a UA lead would want to see it.
Test the fall-back. I recommend dropping to monthly after a trigger. I have not measured how much that recovers, or how long the weekly model takes to become trustworthy again after a break. Both are answerable with the data I have.
Get a weekly spend feed for the second title. The grain comparison is a single-account result on the cost side because the second account has monthly spend only. That is the same one-title limitation that has caught me elsewhere in this study, and I would not promote a grain rule to a default on one game.
The broader lesson
I went in expecting an accuracy contest and came out with a division of labour. The grain question is not “which is more accurate” but “which is more useful for which job”, and the jobs are different: forecasting a plan, detecting that the plan is broken, and recovering afterwards. The finer grain is better at the first two and worse at the third, and no single grain does all of them.
The reversal on cohorts is the part I keep coming back to. The same change — four times as many observations — helps a quantity that does not compound and hurts one that does. Data volume is not a virtue in itself. What matters is what the model does with each additional observation, and a chained model does something quite dangerous with it.
Sources
Every figure above traces to one of these tables:
weekly__weekly_model_selection— the weekly ranking, quarter-plan scores and trigger countsweekly__weekly_monthly_reconciliation— the two grains summed to the panel